
The Curve That Knows When Money Is Getting Nervous
A yield curve looks harmless. It is just a line on a chart, the kind of thing analysts put into slide decks when they want the room to believe something serious is being discussed. But when that line bends the wrong way, it can change the price of a mortgage, squeeze a bank's profit margin, slow a startup's funding round, lift the dollar, punish an emerging-market borrower and make a central banker sound less certain than usual.
That is the strange power of the yield curve. It is not a law, and it is not a prophecy. It is a crowd of lenders, borrowers, traders, banks, pension funds, insurers, governments and central banks arguing every day about one question: what is money worth at different points in time?
Most financial charts show what something is worth now. The yield curve is different. It is a map of time. It tells you what investors demand to lend money for one month, three months, two years, ten years or thirty years. That makes it one of the most compact descriptions of an economy's mood.
What the curve actually is
Start with a government bond. If you buy a US Treasury bill that matures in three months, you are lending money to the US government for a very short period. If you buy a 10-year Treasury note, you are lending for a decade. The yield is the annualized return investors demand for holding that instrument. The US Treasury publishes official Daily Treasury Par Yield Curve Rates across maturities, which is one of the standard reference points for watching this line move.
A yield curve simply lines up those yields by maturity. Short maturities sit on the left. Long maturities sit on the right. Connect the points and you get the curve.
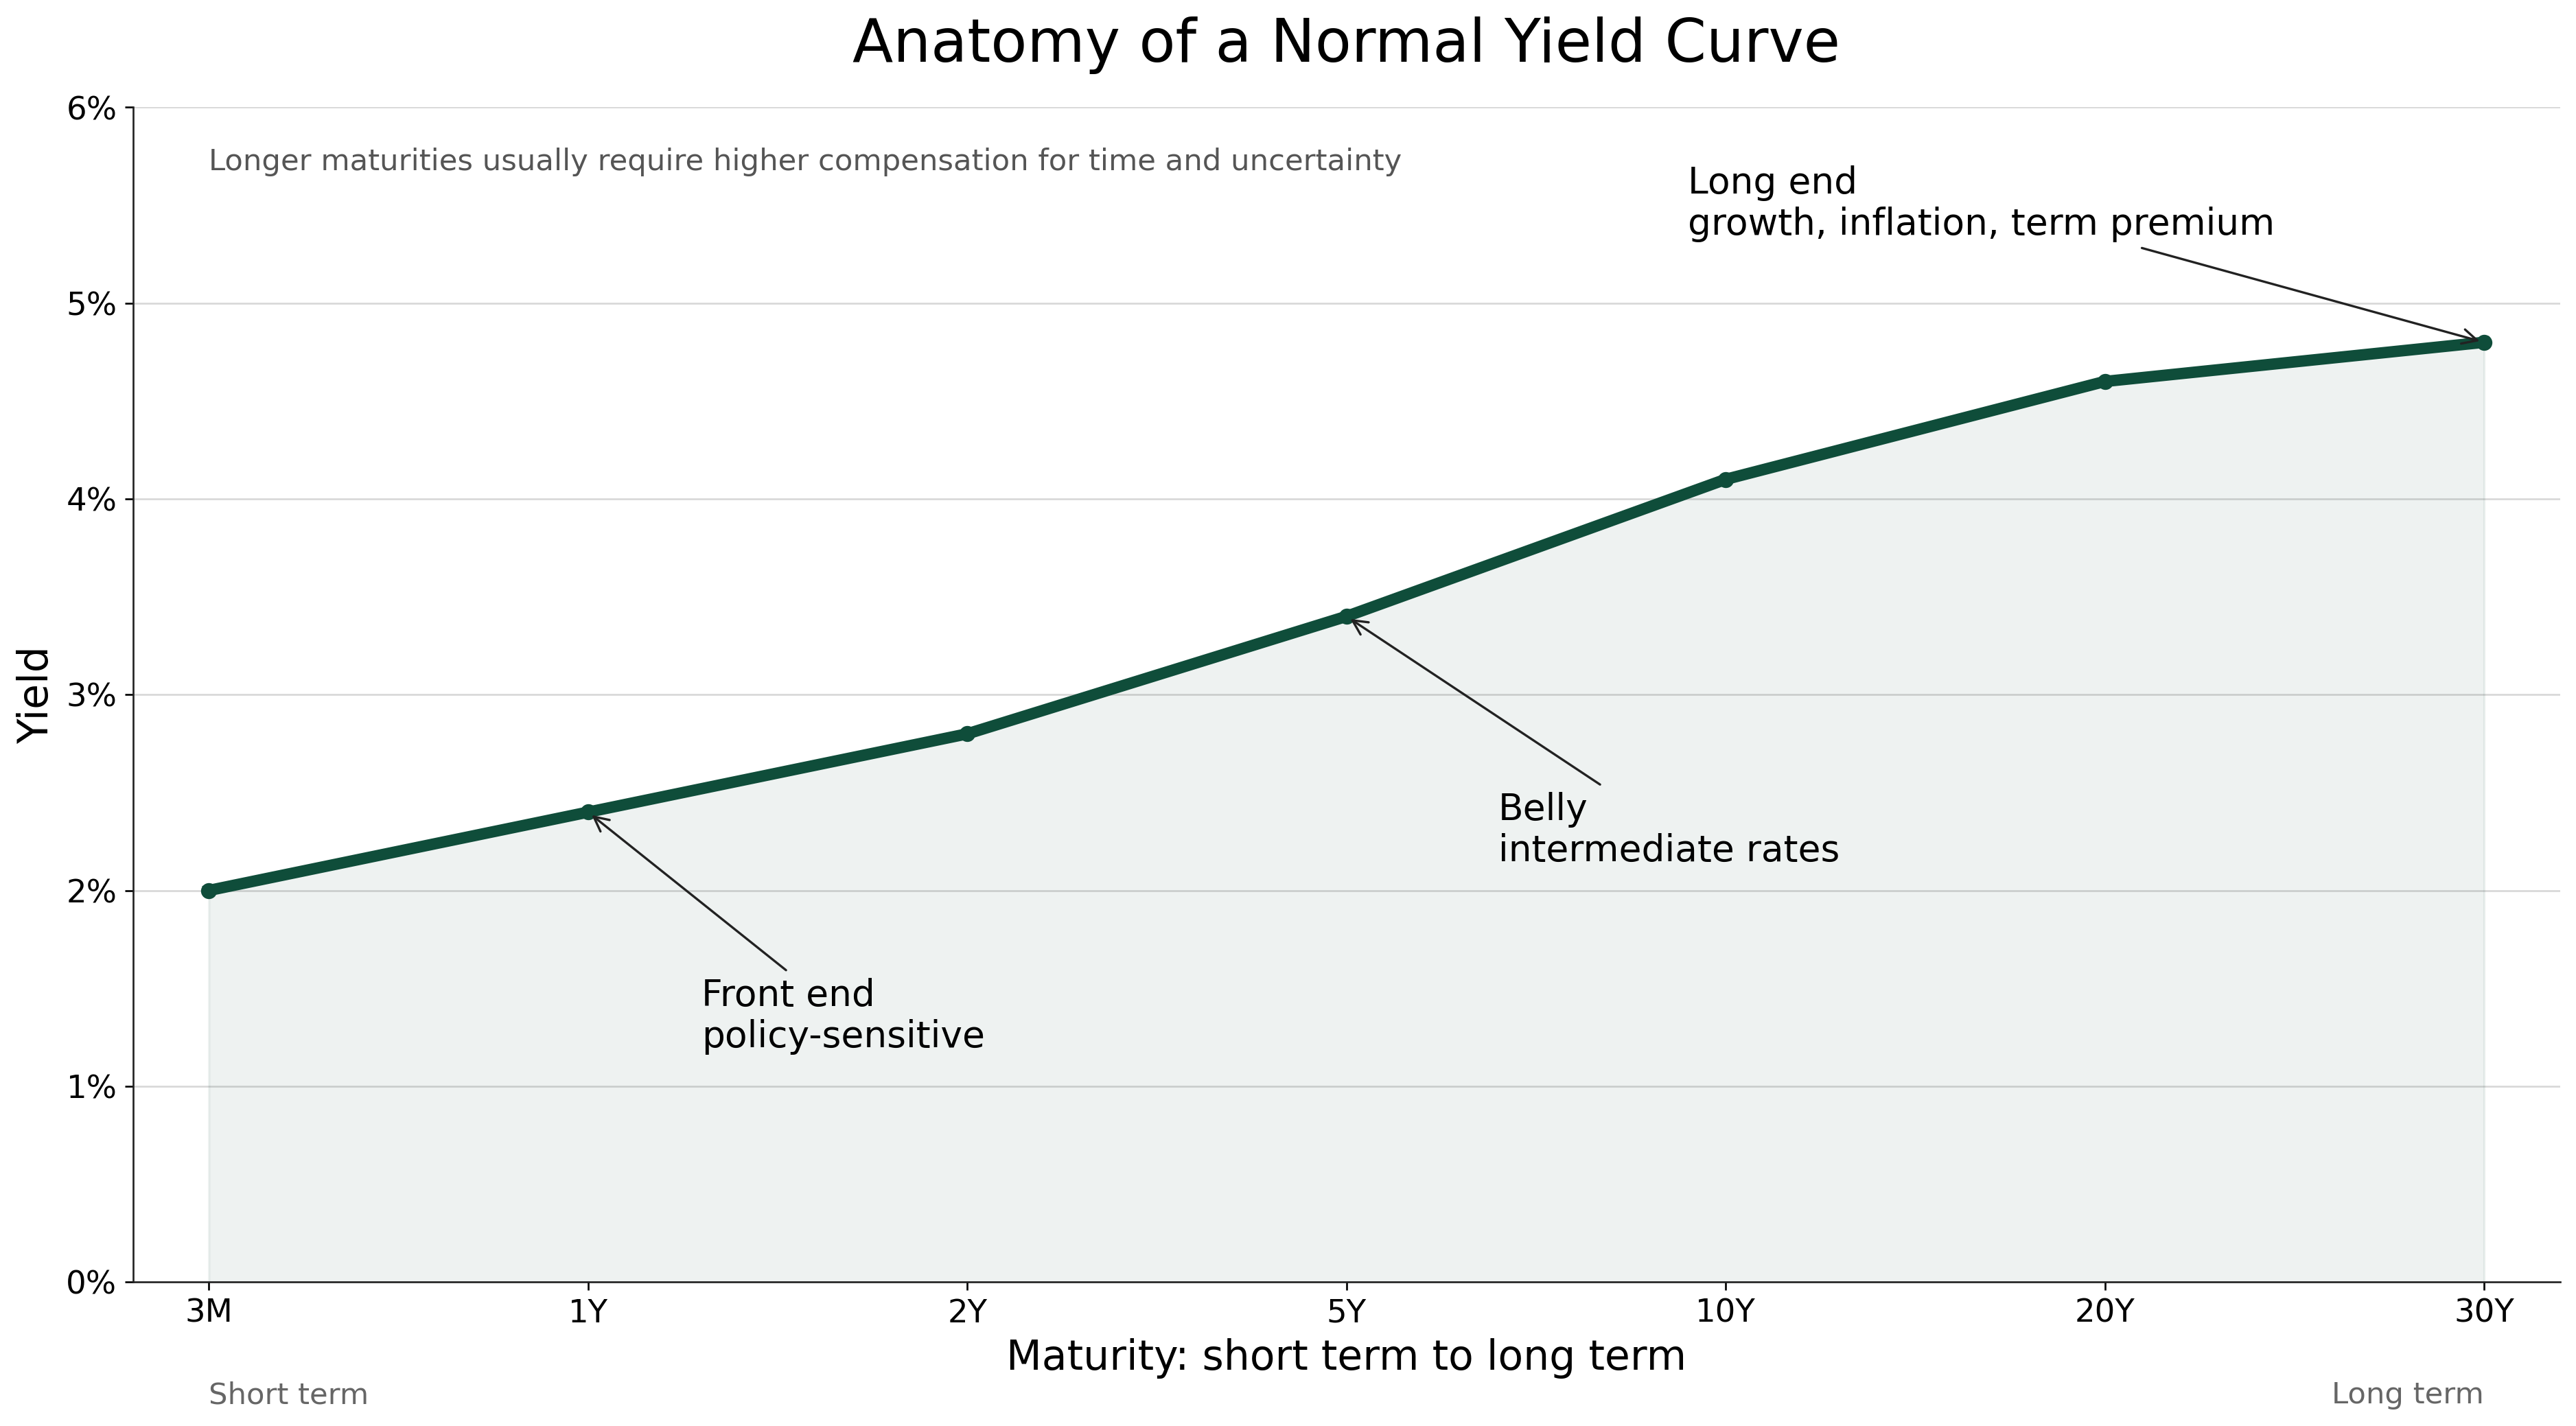
In ordinary times, the curve slopes upward. Lenders usually demand more yield to part with money for longer. Ten years is riskier than three months. Inflation may change. The government may issue more debt. Growth may surprise. A better investment may appear. The longer the commitment, the more compensation investors normally want.
That extra compensation has two pieces. One is the market's expectation of future short-term interest rates. The other is the term premium: the extra reward investors require for holding a longer-term bond instead of rolling short-term bills again and again.
This is where the curve becomes more than a chart. A short-term rate is heavily influenced by central-bank policy. A long-term rate is influenced by expected future policy, inflation expectations, growth expectations, fiscal credibility, global savings, pension demand, foreign reserve managers and fear.
The front end of the curve is where central bankers speak loudly. The long end is where the market talks back.
Normal, flat, inverted and steep
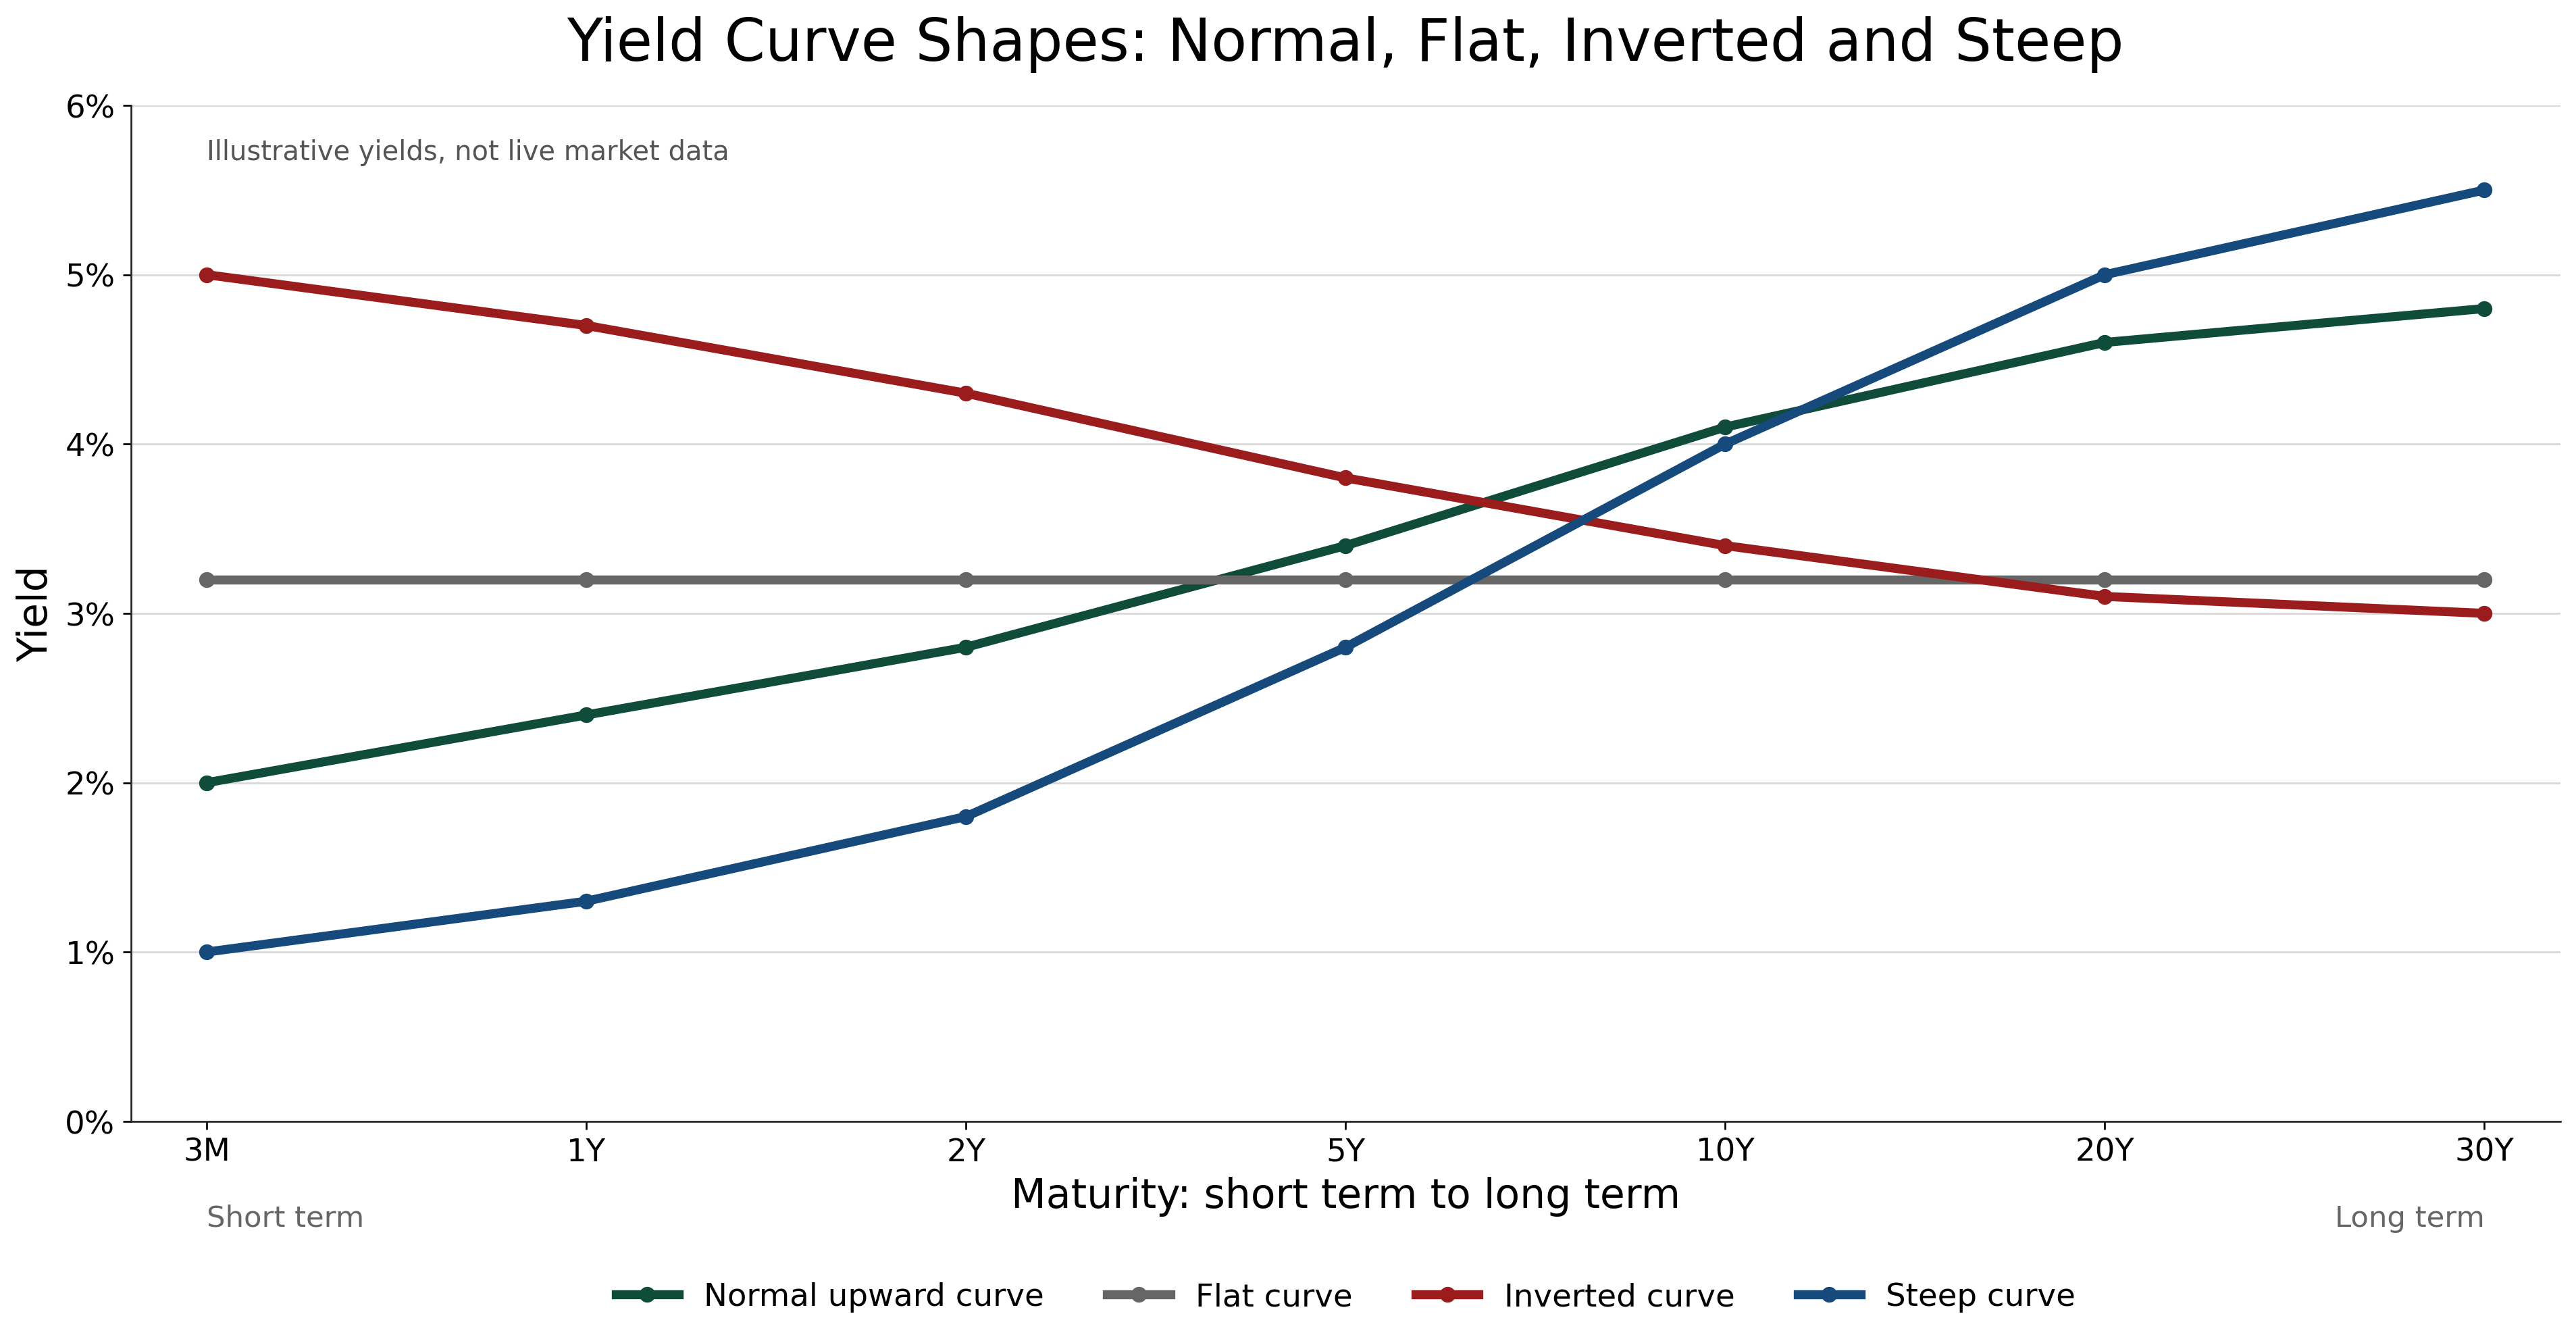
A normal curve slopes upward: short rates are lower than long rates. This often suggests markets expect growth, inflation or at least a normal reward for waiting.
A flat curve means the difference between short and long rates has narrowed. The market is saying: the future may not be much better than the present, or short rates are already high enough to slow things down.
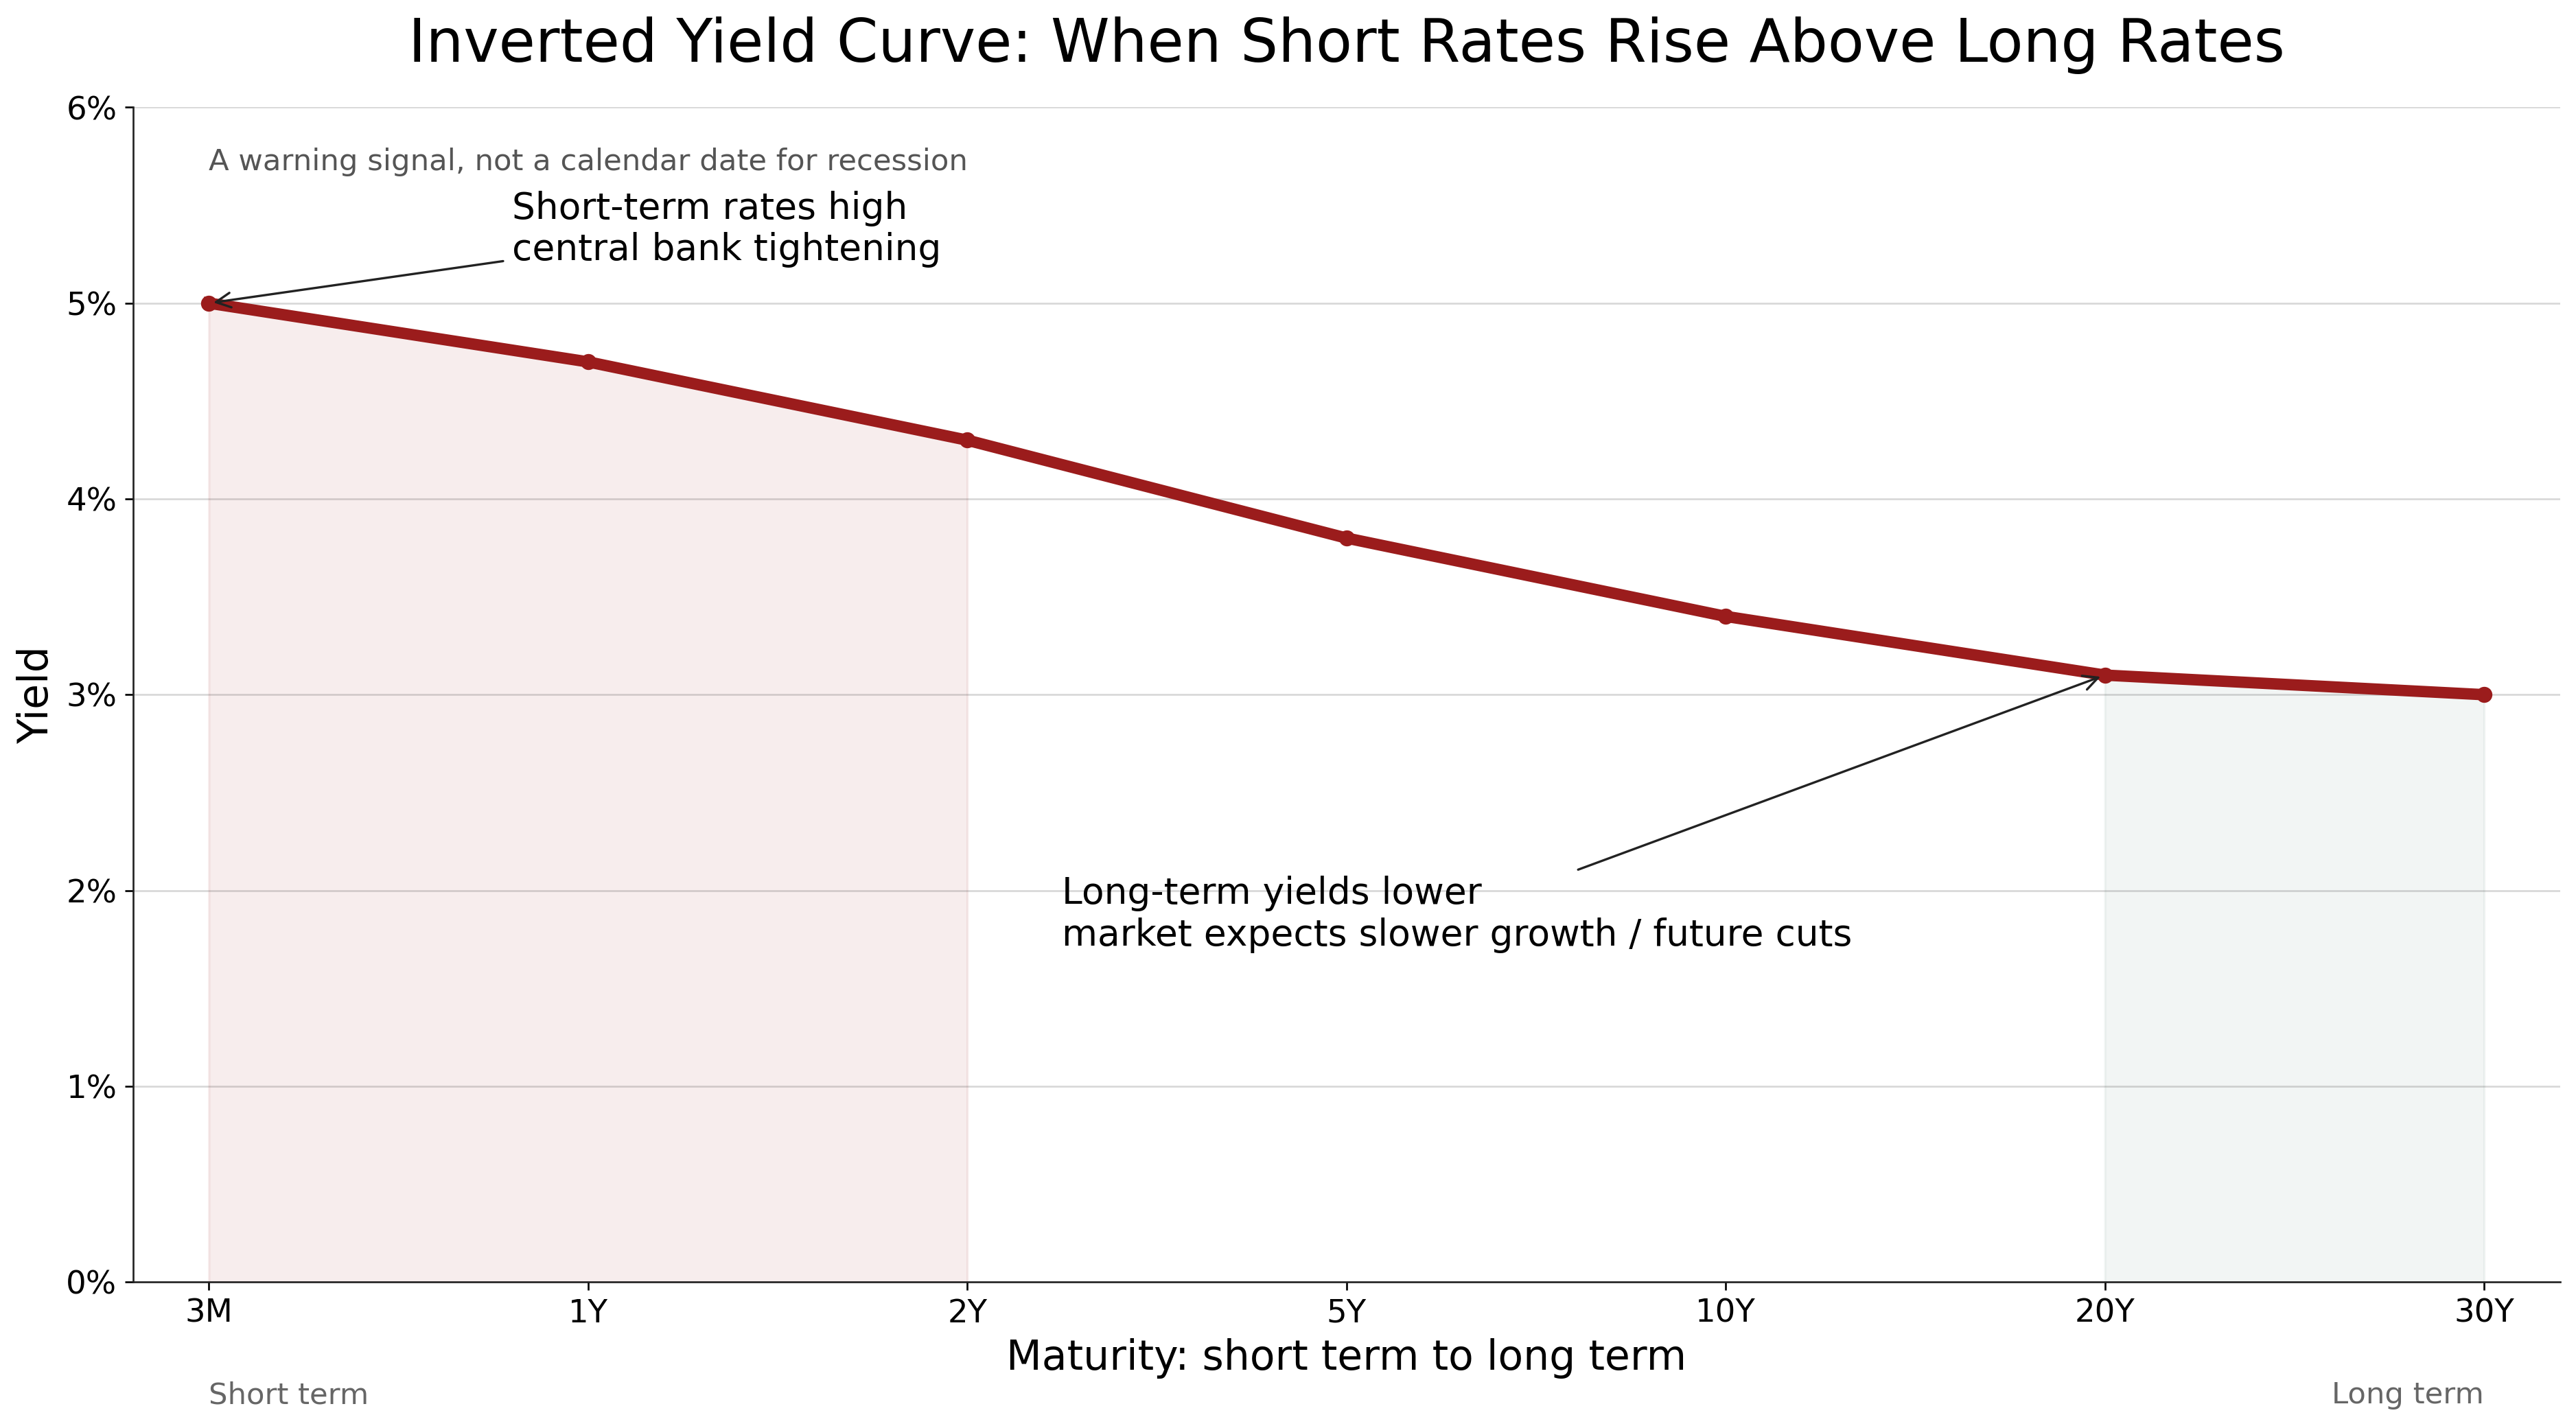
An inverted curve means short rates are higher than long rates. That looks unnatural because investors accept less yield for lending for longer. But it can happen when central banks raise short-term rates aggressively while investors believe future growth and inflation will weaken enough to force lower rates later.
A steep curve means long rates are much higher than short rates. This can be comforting if it reflects expected growth. It can be uncomfortable if it reflects inflation fear, fiscal anxiety or a bond market demanding more compensation for long-term risk.
The words matter because the same shape can have different meanings. A curve can steepen because long rates rise, which may tighten financial conditions. It can also steepen because short rates fall, which may reflect policy easing. Traders call these different animals, but the practical point is simpler: always ask which part of the curve moved, and why.
Why an inversion makes people nervous
The yield curve's fame comes from recession prediction.
One common measure is the spread between the 10-year Treasury yield and the 3-month Treasury bill rate. The New York Fed uses that spread to estimate the probability of a US recession twelve months ahead. The Cleveland Fed also uses yield-curve slope in models of future GDP growth and recession probability.
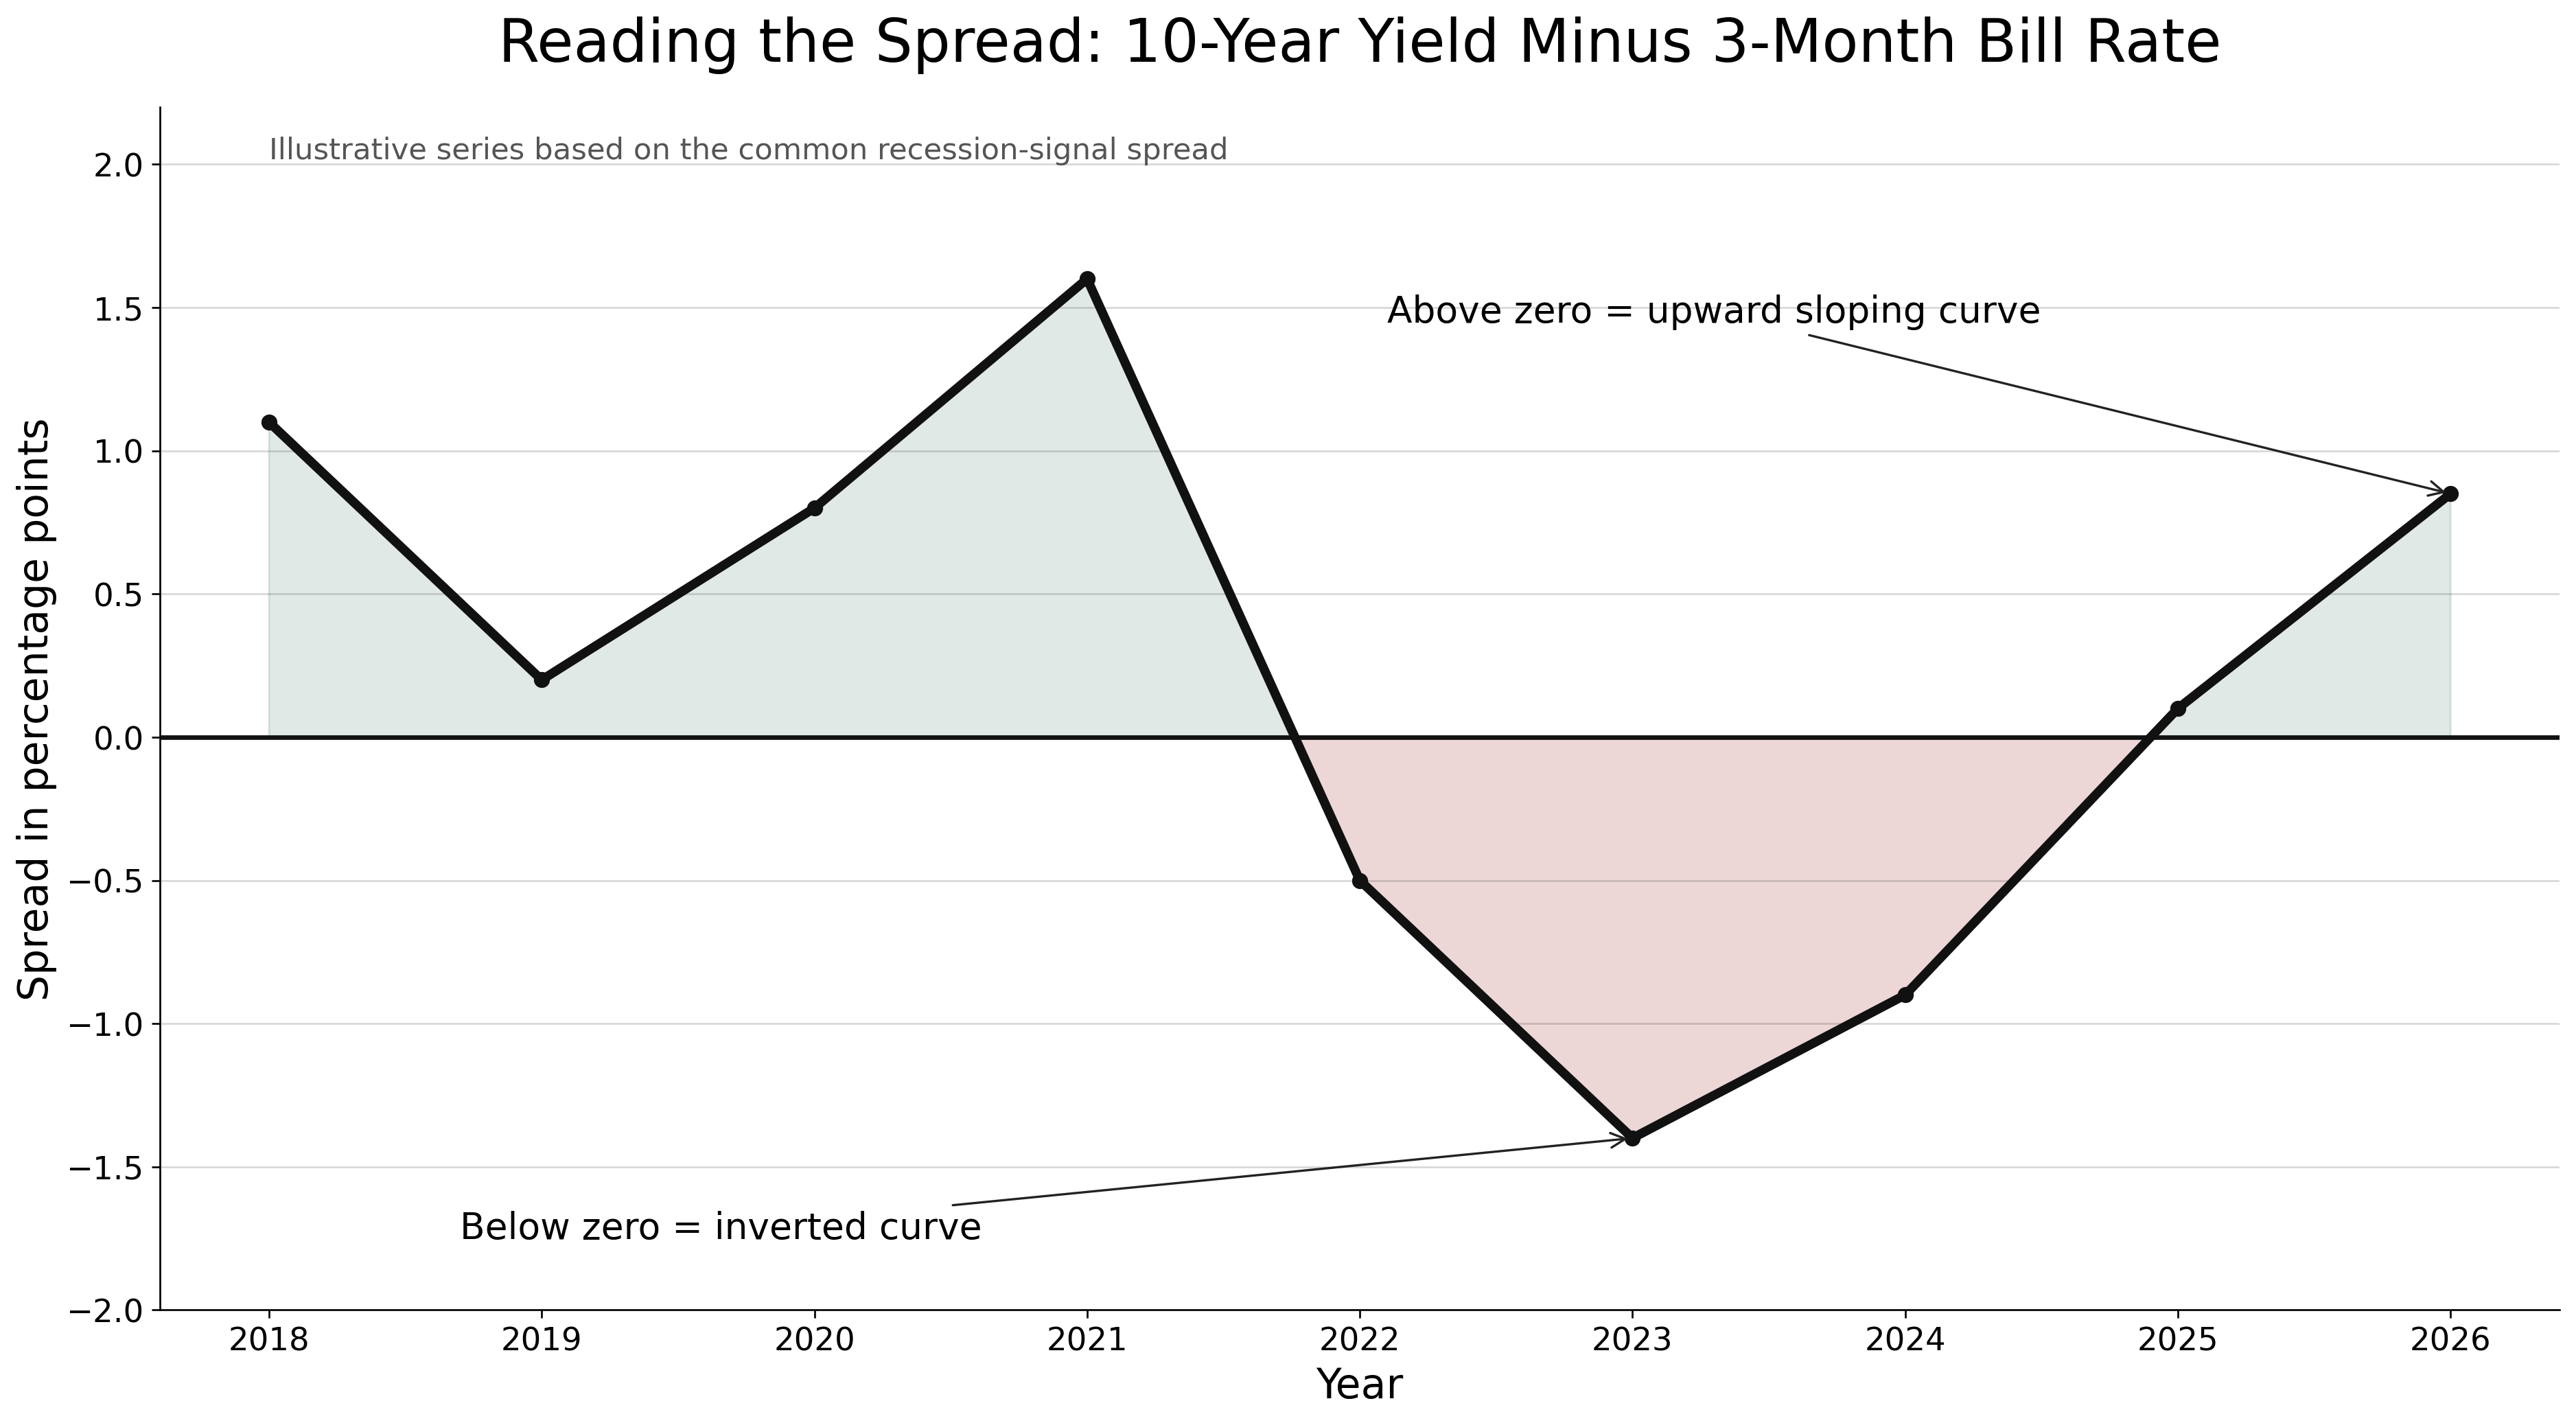
The logic is intuitive. If the central bank has pushed short-term rates high to fight inflation, borrowing becomes more expensive. Banks, consumers and businesses become more cautious. At the same time, if investors expect that tightening to slow the economy, they may buy longer-term bonds in anticipation of future rate cuts, pushing long yields down. The result can be inversion.
An inverted curve is not the recession itself. It is the market pricing a future in which today's tight money eventually breaks something, cools demand or forces policy to reverse.
Historically, that signal has been powerful but imperfect. The Cleveland Fed notes that inversions have preceded each of the last eight US recessions, while also identifying false positives such as late 1966, late 1998 and the long inversion from late 2022 through late 2024. That last point matters. A signal can be useful and still fail on timing.
This is why the yield curve should not be treated like a magic alarm. It is better read as a pressure gauge. It tells you when the cost of money, growth expectations and risk appetite are pulling against each other.
How the Fed enters the curve
The Federal Reserve does not directly set the 10-year Treasury yield every morning. It sets the target range for the federal funds rate, the overnight rate at which banks lend reserve balances to one another. But changes in that target normally move other interest rates and broader financial conditions.
When the Fed tightens, short-term yields tend to rise quickly. Money-market funds, Treasury bills, bank funding rates and floating-rate loans adjust. Longer maturities respond to what the market thinks the Fed will do later.
If the market believes the Fed will keep rates high for years, long yields may rise too. If the market thinks high rates will cause a slowdown and future cuts, long yields may fall even while short rates remain high.
That is how the same rate hike can produce different curves in different moments. The curve is not just reacting to today's policy. It is judging tomorrow's consequences.
The banking angle
For banks, the curve is not academic. It affects the basic business of borrowing short and lending long.
Banks often pay short-term or demand-based rates on deposits and earn longer-term rates on loans and securities. When the curve is upward sloping, that structure can be profitable. Funding is relatively cheap, assets yield more and net interest margins expand.
When the curve flattens or inverts, the business becomes harder. Deposit costs rise. New loans may not offer enough spread. Securities bought when yields were lower may sit on balance sheets with unrealized losses if market yields rise. Borrowers refinance less. Credit demand may weaken.
This matters for payments and fintech companies because bank partners do not make decisions in a vacuum. A sponsor bank under margin pressure or liquidity stress may become less willing to onboard risky payment flows. It may reprice accounts, demand higher reserves, reduce exposure to MSBs or become more selective about fintech programs.
A client can be legally licensable and still become commercially harder to bank when the curve is sending the wrong message.
The borrower angle
For households and companies, the curve leaks into daily life through pricing.
Mortgage rates tend to care about longer-term rates. Corporate borrowing costs depend on Treasury yields plus credit spreads. Venture funding gets affected because higher risk-free yields make future cash flows less valuable. Private credit funds may charge more. Emerging-market borrowers with US-dollar debt may face tougher refinancing.
For a company planning market entry, the curve can change the answer to basic questions. Should we raise now or wait? Should we fix the rate or float it? Should we hold more cash? Should we expand in a high-rate market or conserve capital? Should we quote customers in local currency or US dollars?
The curve does not answer those questions by itself. It tells you the weather in which those decisions will be made.
FX, carry and the dollar
The yield curve also feeds the foreign-exchange market.
Currencies are partly moved by interest-rate differentials. If US short-term rates are much higher than rates elsewhere, global investors may prefer dollar assets. That can support the dollar, tighten global dollar liquidity and make dollar debts more expensive for borrowers outside the United States.
Carry trades depend on this. Investors borrow in a low-yielding currency and invest in a higher-yielding one. The trade works while exchange rates behave and funding remains available. It can unwind violently when volatility rises or when the expected interest-rate path changes.
For emerging markets, the US curve can matter even when the local central bank is doing its own thing. A rising long end in the United States can pull global yields upward. A strong dollar can pressure imports, reserves and debt service. A flat or inverted US curve can signal caution toward risk assets, making capital more selective.
That is why a payments consultant should care. FX spreads, prefunding costs, settlement-bank appetite and corridor economics all move with the price of money.
Stablecoins and the curve
Stablecoins added a new audience for the yield curve.
A fully reserved dollar stablecoin typically holds backing assets such as bank deposits, Treasury bills, repo or money-market instruments. When short-term rates are high, the reserve portfolio can generate substantial income. When short-term rates fall, that income falls too.
This changes the economics of the business. A stablecoin issuer's revenue may depend less on transaction fees and more on reserve yield. That creates incentives around scale, reserve composition, banking relationships and disclosure.
It also changes user expectations. In a high-rate world, customers may ask why the issuer earns yield while token holders receive none. In a low-rate world, issuers may look for other revenue sources, which can introduce risk if reserves become less conservative.
The yield curve therefore shows up inside crypto market structure. It affects stablecoin profitability, tokenized Treasury products, DeFi lending rates and the appeal of on-chain cash management.
Did you know?
The United States once practiced yield curve control. During World War II and the years immediately after, the Federal Reserve helped keep Treasury borrowing costs low by supporting a pattern of rates across maturities. The 1951 Treasury-Fed Accord ended that arrangement and restored more monetary-policy independence. A Chicago Fed review of that period notes that when long-term yields rose after the regime ended, investors holding longer-term securities faced capital losses and credit availability tightened in parts of the mortgage market.
The curve most people watch is not one single universal curve. Traders may look at the 2-year versus 10-year spread, economists may prefer 10-year versus 3-month, and funding desks may care about overnight rates, bills, SOFR curves and swap curves.
A steep curve is not always good. If it steepens because investors expect growth, that may be healthy. If it steepens because investors demand more compensation for inflation, fiscal risk or debt supply, it can be a warning.
Where the curve helps, and where it misleads
The yield curve helps because it compresses millions of decisions into one picture. It tells you how markets price time, inflation, policy, growth and uncertainty. It is especially useful because it links macroeconomics to real business decisions.
But it misleads when people turn it into a superstition.
An inversion does not tell you the exact date of a recession. A normal curve does not guarantee safety. A steep curve does not always mean confidence. Quantitative easing, foreign reserve demand, bank regulation, pension flows, fiscal deficits and risk appetite can all distort the curve.
The better use is comparative. What changed? Was it the front end or the long end? Was the move driven by inflation, growth, policy expectations, debt supply or flight to safety? Did credit spreads move with it? Did the dollar move with it? Did bank stocks, mortgage spreads and funding markets confirm the signal or contradict it?
A curve is powerful because it is simple. It is dangerous for the same reason.
The practical takeaway
For a banking, payments, FX or crypto-market consultant, the yield curve should be part of the first screen of market context.
Before advising a client on licensing, banking access, treasury setup, stablecoin reserves, cross-border corridors or funding strategy, ask what the curve is saying about the price of time.
If short rates are high, customer funds, prefunding balances and stablecoin reserves may produce income, but bank partners may also tighten standards. If the curve is inverted, growth may look fine today while credit conditions quietly worsen. If long rates are rising, borrowers, mortgage-linked markets, venture valuations and emerging-market corridors may all feel the squeeze.
The yield curve is not the economy. It is the economy's calendar of expectations.
And when that calendar begins to bend, money has already started changing its mind.
Important sources
U.S. Department of the Treasury, Daily Treasury Par Yield Curve Rates: https://home.treasury.gov/resource-center/data-chart-center/interest-rates/TextView?type=daily_treasury_yield_curve
Federal Reserve, The Fed Explained - Monetary Policy: https://www.federalreserve.gov/aboutthefed/fedexplained/monetary-policy.htm
Federal Reserve Bank of New York, The Yield Curve as a Leading Indicator: https://www.newyorkfed.org/research/capital_markets/ycfaq
Federal Reserve Bank of Cleveland, Yield Curve and Predicted GDP Growth: https://www.clevelandfed.org/indicators-and-data/yield-curve-and-predicted-gdp-growth
Federal Reserve Bank of Chicago, Yield Curve Control in the United States, 1942 to 1951: https://www.chicagofed.org/publications/economic-perspectives/2021/2